How to measure WiFi performance
In the beginning there was just a single a FritzBox as wifi access point and it was good. Only two stories up in the bedroom I did have a flaky Wifi network at times. So I decided to put a wire in the bedroom and put a 20€ Satechi minirouter in there. Cheap thing, but doing it’s job fine - it is a bedroom with just my iOS device charging there at night.
Now that I had two access points (same wifi network, same password, different channel) in the house, things started to get weird. I was connected to the access point further away for no good reason and I had miserable connections sometimes.
Why is the network bad with more access points ?
I had set up everything correctly. I was only using channels 1,6,11 and using 20MHz wide channels to not interfere with my neighbours. I read about Wifi roaming then and found out that the devices decide on their own which access point to use. iOS devices are particularly clingy however. iOS devices stay as long as they see an access point on it. They will only change the access point when they don’t see it anymore. So when you are moving in the house they stay too long on the access point they connected first with.
You can purchase wifi systems that kick the device from an access point when the wifi controller sees that the devices are closer to another access point. My neighbour has one of those and I’ve heard no good things using them with iOS/OSX devices from him. It seems that sometimes the devices get kicked from an access point but try to stay with that one and that creates troubles.
Zero Handover
I then read about Zero Handover from Ubiquiti devices. They use the same WiFi channel to create a single network for the devices. The wifi devices see only one access point and the access points figure out (on the ethernet side) which device to talk to from which access point.
I heard good things about them and have had good experience with a 6km Wifi connection with a ubiquiti nano station in the past. So I bought two of them a UniFi AP and a UniFi AP-LR. I put them in the same location as the Fritbox and the Satechi router previously.
Then the dropouts in Skype and Facetime began. The picture would freeze and only get better after a couple of seconds. Nothing that bad I encountered in my house before. So I began trying to figure out what was going on.
I tried to find comparisons on the net and they all were very high level. Maybe a speed test at max, but nothing describing my use case. I only need halfway decent performance (cause when I need speed I just use ethernet) but perfect quality of service.
Poor mans testing
I started with ping - which had a little packet loss. I then started copying files over the wifi network and looked at the traffic Menumeter drew in the menu bar. Nothing to see there, go away. I started creating empty traffic pipes with the command line:
dd if=/dev/zero bs=1m |(ssh fe80::aabb:ccff:feaa:bbcc%en0 'cat >/dev/null')
and watched the traffic with netstat -I en0 1
leaving it alone for some time I could see traffic dropouts. No traffic for some seconds. My ssh shells pipe even broke sometimes. I decided to venture more into network testing then.
My own Testing
I created my own test installation then. A Mac mini connected via ethernet running as iPerf server. A MacbookPro Retina as iPerf client connected to the Wifi access point. The office Macbook is located in the the room below my bedroom, so there is only one ceiling in between, distance about 4-5 meters.
So naturally I converted the file looking like:
Connecting to host fe80::aabb:ccff:feaa:bbcc%en0, port 5201
[  4] local fe80::aabb:ccff:feaa:bbdd port 50764 connected to fe80::aabb:ccff:feaa:bbcc port 5201
[ ID] Interval           Transfer     Bandwidth
[  4]   0.00-0.51   sec  2.58 MBytes  42779 Kbits/sec
[  4]   0.51-1.00   sec  2.27 MBytes  38443 Kbits/sec
[  4]   1.00-1.50   sec  2.33 MBytes  39149 Kbits/sec
[  4]   1.50-2.01   sec  2.21 MBytes  36509 Kbits/sec
[  4]   2.01-2.50   sec  2.46 MBytes  42010 Kbits/sec
[  4]   2.50-3.00   sec  2.84 MBytes  47187 Kbits/sec
[  4]   3.00-3.50   sec  2.91 MBytes  49271 Kbits/sec
[  4]   3.50-4.01   sec  2.62 MBytes  43490 Kbits/sec
[  4]   4.01-4.50   sec  2.93 MBytes  49844 Kbits/sec
[  4]   4.50-5.00   sec  2.33 MBytes  38862 Kbits/sec
[  4]   5.00-5.51   sec  2.43 MBytes  40610 Kbits/sec
[  4]   5.51-6.00   sec  2.32 MBytes  39460 Kbits/sec
....
To a graph that looked like this:
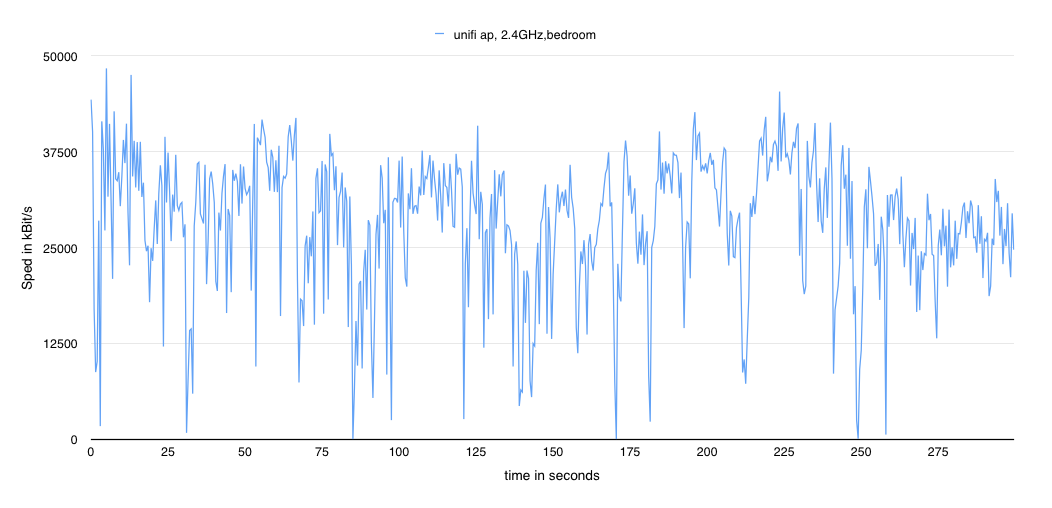
I can see that the maximum speed is about 50MBit and there are dropouts that go down to almost 0 Bit/s as it seems. So I thought about better visualising what I got and wrote a script that just counted the time-slots for each speed record.
This looks like this:
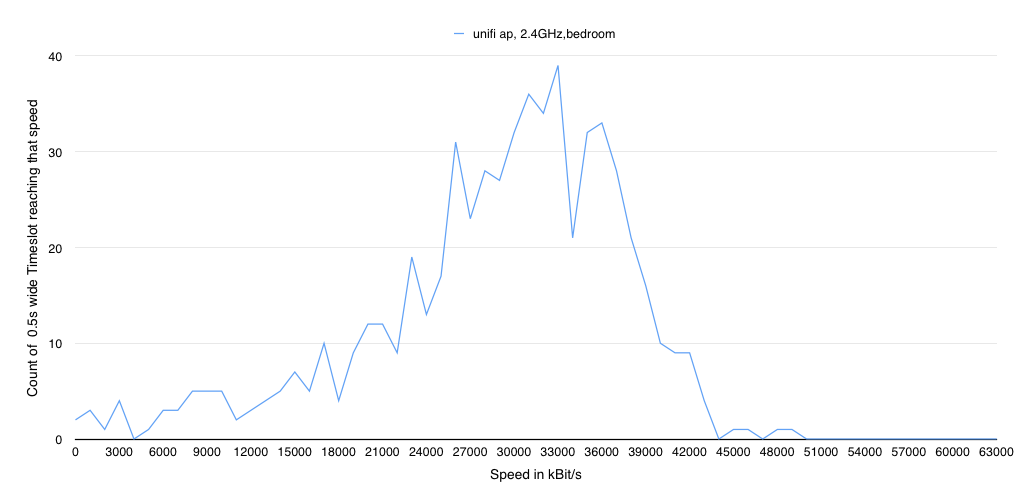
This image much more is readable and shows that most of the time the speed is between 25-40 MBit/s. I then did a couple of tests and the graph looked like this:
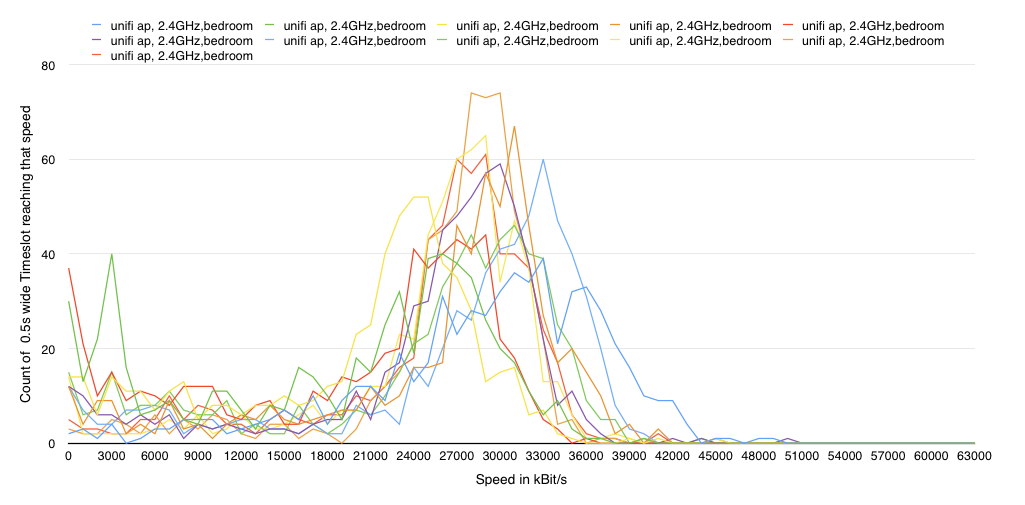
Normalising I could even express Percentages:
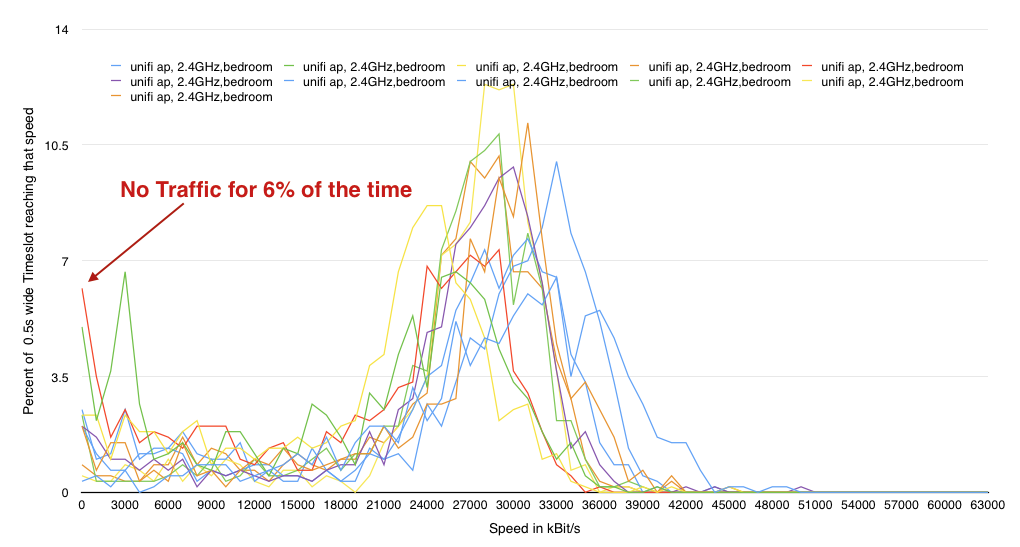
As you can see I would get about 6% of the time NO packets through at all in half hour long measurements. So that’s were the dropouts in Skype and Facetime come from.
Now that I had the data in some more understandable form, I thought I could graph the different results as a heatmap:
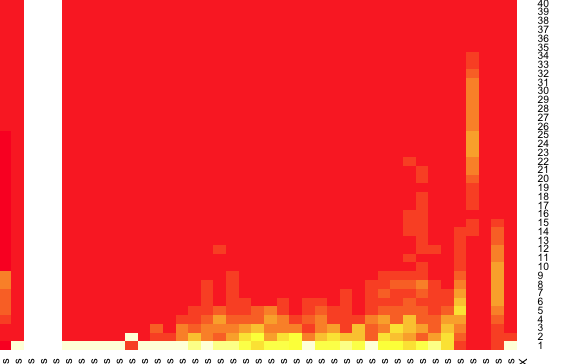
You can see the performance graph from before in there, but nothing that you can look on and see right away what is going on. I figured that I wanted to have the sum of the percentages - which looks like this:
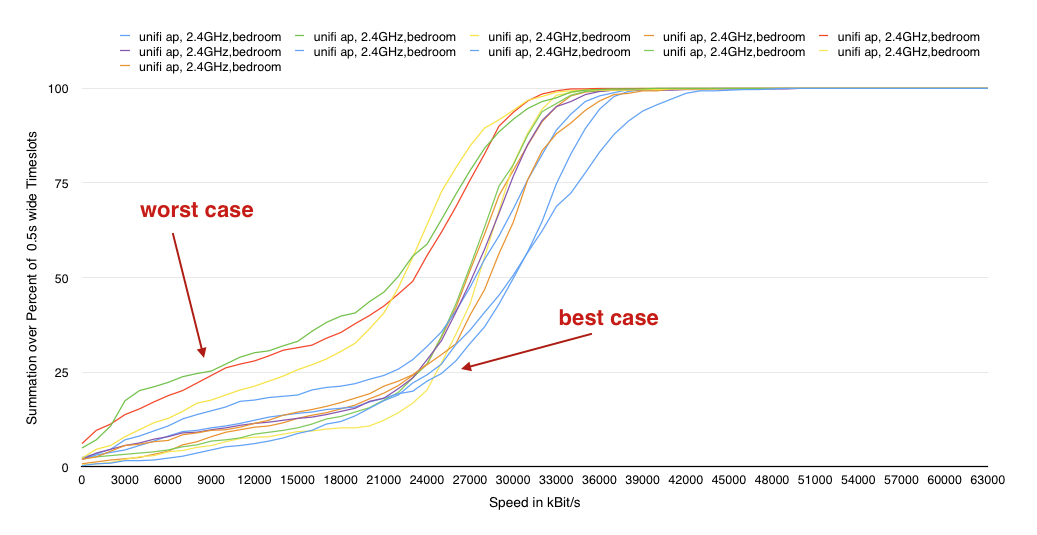
So this now means that 25% of the time the traffic is below 8-9 Mbit/s in the worst case (green line) and below 26MBit/s in a best case scenario.
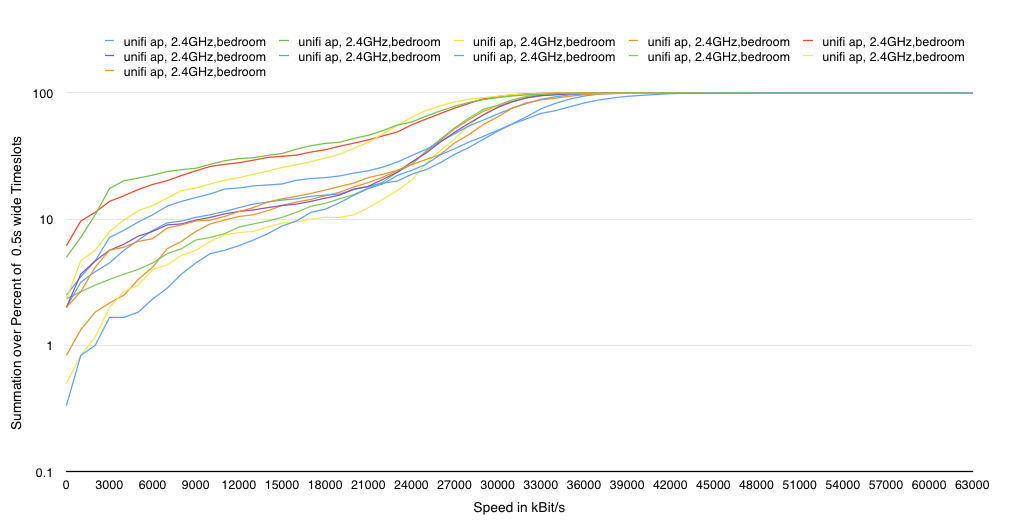
Thinking that this might be even more interesting in logarithmic scale:
I could not believe the results and retried at a different location just 3 meters away in plain sight from the MacBookPro started my test. In a second test I disabled ZH and for comparison a airport express I had lying around:
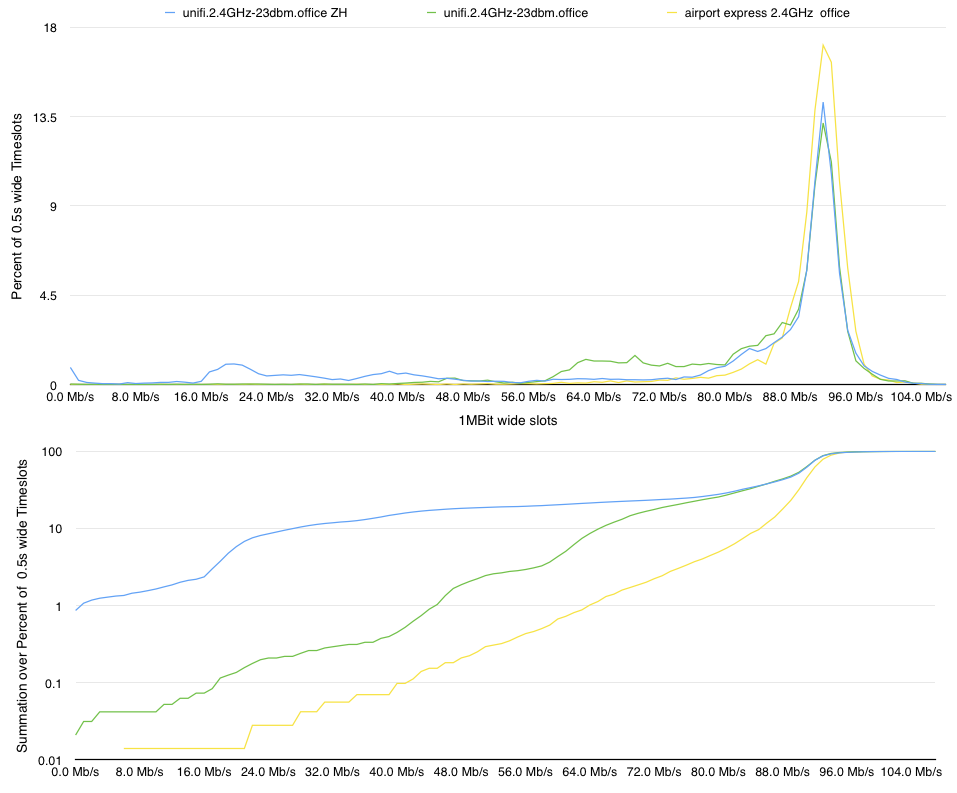
The results for the Unifi improved now that it was in plain sight of the MBP. I then halfed the slot size for the counting from 1Mbit/s to 500kBit - as you see the percentage graph differs now , but the summation graph just stays the same, except getting a better resolution.
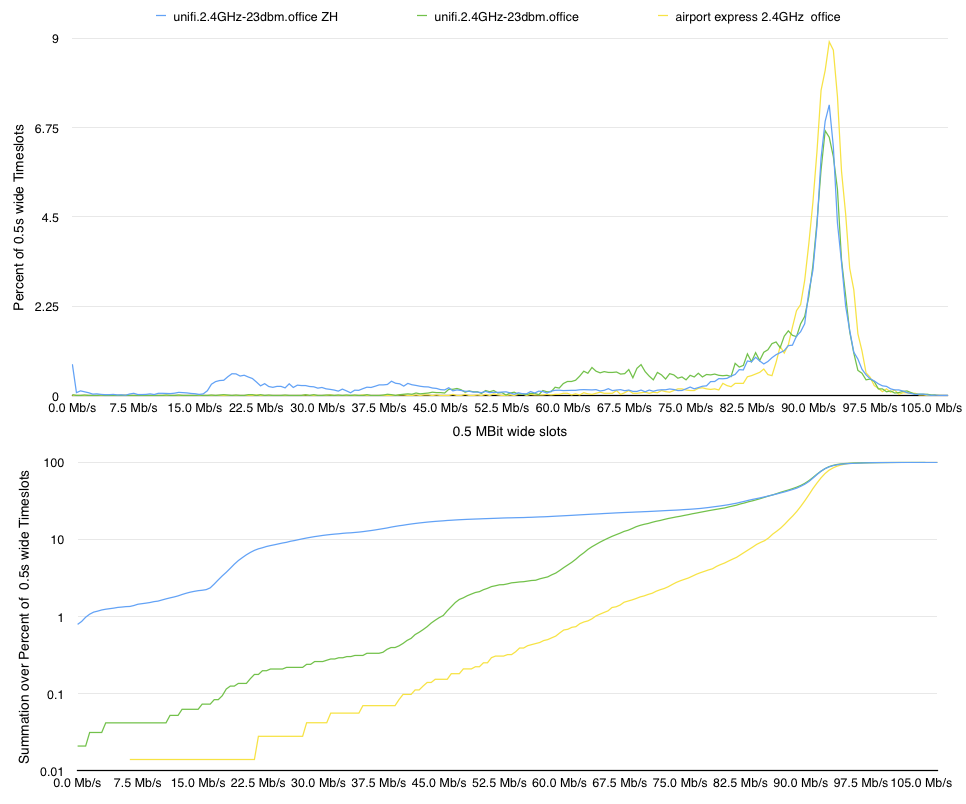
Zooming in with 10kBit wide slots you see the peak at 0.66% for ZH where there is traffic below 10kBit - so no traffic at all.
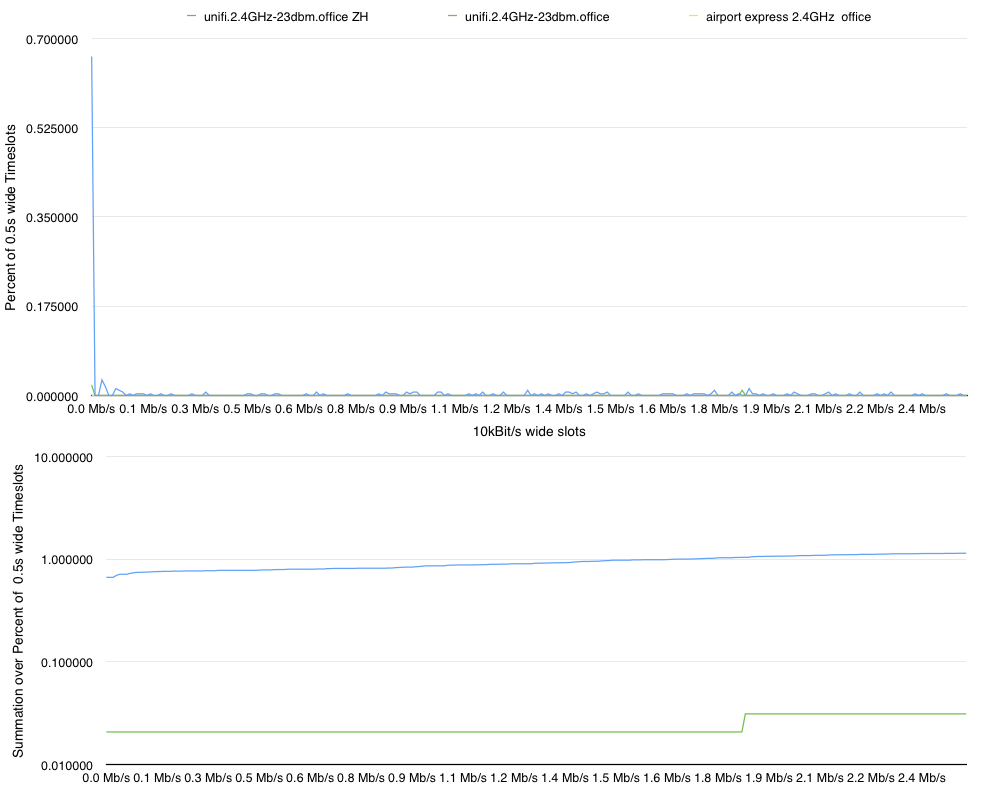
Performance improved without ZH as one would expect. Using ZH you get .66% of the time with no bandwidth. In a 15minute voice call you have 6 seconds of no bandwidth - and that is when you are directly beside an accesspoint.
As I did have a Apple Airport Express at hand, it tested that as well. Not unexpected the Airport Express did a very good job at connecting to the MacBookPro: a fantastic minimum bandwidth of 6.5Mbit/s. So - I presume it does make that difference when you are the manufacturer and adjust your hardware to each other.